
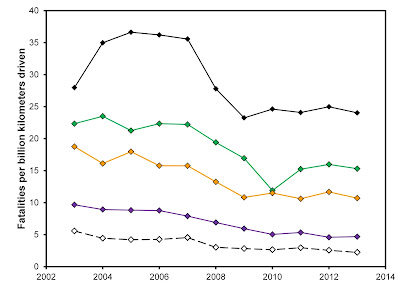
 Figure 1 The fatality rate per billions of kilometres
driven for different vehicles on Great Britain’s roads between 2002 and 2013.
Data from the Department for Transport. Top plot shows all of the data. The
bottom plot shows all of the data except that for motorbikes, but at an
expanded scale for easy reading
Figure 1 The fatality rate per billions of kilometres
driven for different vehicles on Great Britain’s roads between 2002 and 2013.
Data from the Department for Transport. Top plot shows all of the data. The
bottom plot shows all of the data except that for motorbikes, but at an
expanded scale for easy reading
In the last posting (Issue 14) I discussed the effect to shale gas development on road traffic accidents in the USA. So far there
has been little shale gas exploitation within the UK so we would not expect to
see any large changes in the traffic statistics, if any at all. Every September
the Department for Transport issues the annual road traffic accident statistics
for Great Britain. There are data here for what types of vehicle are involved,
the types of road and the number of fatalities, major and minor casualties. We
need only look at one or two aspects of the data. One table sets out the number
of fatalities per billion kilometres driven for different vehicle types and for
each year from 2002 to 2013, the latest year for which data are currently
available. Figure 1 shows that data, with
all of the curves shown in the top plot, and all but the motorbike data shown
in the bottom plot, but on an expanded scale. It is immediately striking that
the general trend is for the fatality rate to decrease as the years pass, which
is consistent with the improvement of road traffic regulations, vehicle design
and public awareness. The only vehicle for which this has not been the case in
the last 6 years is the pedal bike.
 Figure 2 The
fatality rate for different vehicle on Great Britain’s roads between 2002 and
2013 as a fraction of that for cars (i.e., cars = 1.00). Data from the
Department for Transport. Values above 1 show vehicles involved in more
fatalities per billion kilometres travelled, while values less than 1 show vehicles involved in fewer.
Figure 2 The
fatality rate for different vehicle on Great Britain’s roads between 2002 and
2013 as a fraction of that for cars (i.e., cars = 1.00). Data from the
Department for Transport. Values above 1 show vehicles involved in more
fatalities per billion kilometres travelled, while values less than 1 show vehicles involved in fewer.
The next
feature is that fatalities involving motorbikes are by far the worst. Figure 2 shows the same data as the previous
plot, but as a fraction of the data for cars. We can see from this plot that
fatalities involving motorbikes has increased over the years from 14.58 times
larger than that for cars in 2002 to 17.55 times that for cars in 2013. In
other words, kilometer-for-kilometer, it was 17.55 times more likely to die in
a road traffic accident in 2013 if you were driving a motorbike than a car. While
this apparent increase is more to do with the fatality rate for cars dropping
faster than that for motorbikes, getting on a motorbike is, perhaps, something
that one should think twice about for one’s own sake as well as the sakes of
one’s parents, spouses and children. Riding pedal bikes on the road is also
dangerous with 24 fatalities per billion kilometers pedalled in 2013, a rate
that has not dropped significantly since 2009 – in fact 5.13 times more deaths
per kilometer involved a bicycle than involved cars, but perhaps we should
console ourselves that few of us clock-up sufficient kilometers on a bicycle to
be too much at risk. The next most dangerous way to travel is, surprisingly,
coaches and buses, which in 2013 had a fatality rate 3.27 times that of cars on
a kilometer-by-kilometer basis. Perhaps the biggest surprise is the rate of
fatalities involving ‘white van man’. Vans and light goods vehicles had a
fatality rate in 2013 of only 2.2 deaths per billion kilometers driven having
decreased year-on-year for the last decade. That is less than half of the
fatality rate involving cars. Clearly the reputation ‘white van man’ has for
bad driving is not only not deserved, we should be lauding their safety record.
Shale gas
exploitation will increase the traffic of all types of vehicles including cars,
coaches and vans. However, it will be heavy goods vehicles that are most
involved. Since 2002 the fatality rate per billion kilometres driven of heavy
goods vehicles has dropped year-on-year from 19 to 11. During that time the
fatality rate remains about twice that of car travel (Figure 2).
The question
is whether these data for heavy goods vehicles will increase if shale gas
exploitation is developed in the UK. The likelihood is that the fatalities caused
by HGVs will increase in proportion to the extra distance travelled by the
vehicles required to service the shale gas industry. The Institute of
Directors’ 2013 study estimated that there would be 312880 truck movements over
the 20 year period of the development of a 100 pad 40 lateral shale gas
industry in the UK in the worst case scenario where all the development water
needs to be trucked in. If we assume that each movement is 200 km and that all
of the movements happen in the same single year, the increase in kilometres
driven in the UK will increase over the 25 billion kilometres reported in the
Department for Transport’s 2013 statistics for Heavy Goods Vehicles by one
quarter of a percent, or when converted into fatalities, 0.68 extra fatalities over
the whole 20 year period of the shale gas development.
Even if the
overall number of fatalities increase, it is unlikely that the rate of
fatalities per billion kilometres driven or the relative fatality rate to that
of cars will change much unless the shale gas-related traffic is driven much
more irresponsibly than the HGVs which are currently being driven in the UK.
Thankfully, the UK’s road traffic and goods traffic regulations are strong and
comprehensive as well as being strictly enforced by inspectors and the police.
It is unlikely that irresponsible HGV operators would be allowed to operate on
the UK’s roads.
There is one
more thing that we have to take into account – these shale gas HGVs will not be
operating on urban roads or motorways for some of their journeys, but on small
country roads. Perhaps the fatality rate on these small rural by-ways might be
increased when huge shale gas lorries start using them? The same Department for
Transport statistics includes a break-down according to road type. Figure 3 shows the fatality rates for each
vehicle type in 2013 but broken down by whether the incidents occurred on rural
or urban roads. Almost all types of vehicle show a higher accident rate on
rural roads. Motorbikes and pedal cycles show the greatest differences. Pedal
cyclists are 2.9 times more likely to die on rural roads than urban roads per
kilometre cycled, while motorbikers are 2.4 time more likely to die on rural
roads. This flies against our intuition. We imagine that the press of traffic
in cities is the cause of the deaths of many cyclists, and so it is – but more
die in the countryside because more cyclists cycle there and a car or a lorry
is just as fatal at a country junction as at a city one. The expected reason
for the statistics for motorbikers is not so clear, though some have associated
it with a penchant for driving fast over winding country trunk roads that is
indulged in by a subsection of the biking community.

Figure 3 The
fatality rate per billion kilometers travelled for different vehicle on Great
Britain’s roads in 2013, comparing urban and rural experiences. Data from the
Department for Transport.
Fatalities
involving cars are 2.1 times more likely on rural roads than urban roads, those
involving buses and coaches slightly more at 1.1 times and vans and fatalities
involving light goods vehicles are 1.8 times as likely on rural roads than
urban ones. The reasons why are not clear. Perhaps the driving is more
challenging. Perhaps people drive with less care and attention in the
countryside. The one vehicle that seems to be slightly safer in the countryside
is the HGV. Once again, we might imagine the effect that a developing shale gas
industry might have on the fatality rates in the countryside. Since Department of
Transport figures show that already HGVs travel 10 billion kilometres per year
on rural roads and only 3.6 billion kilometres on urban roads (with another 11
billion on motorways), it is unlikely that a developing shale gas industry will
make much difference. The earlier comparison with milk tankers seems to be a
fairly accurate portrayal of the impact that shale gas traffic might have on
the countryside.
No comments:
Post a Comment